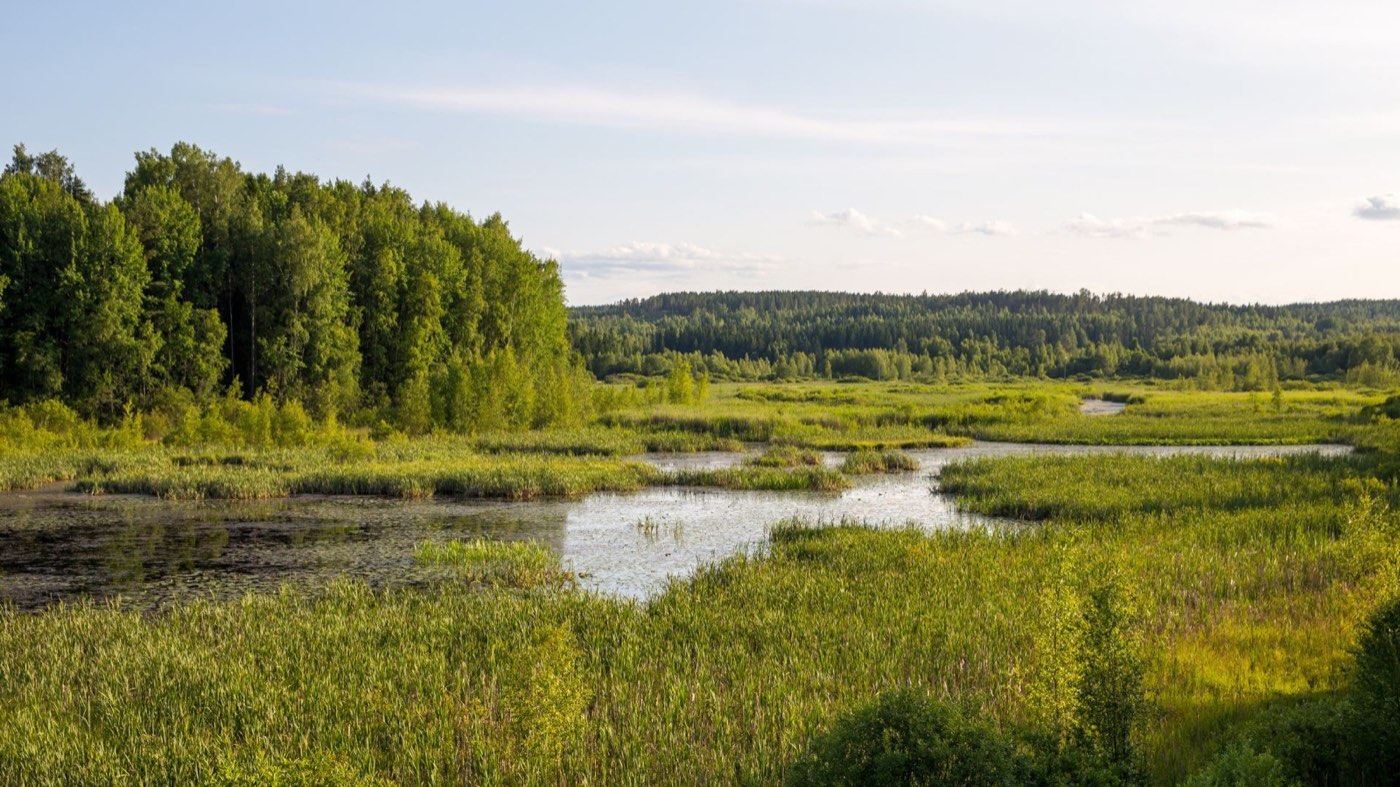
You’ve mapped your wetlands, forests, riparian areas and grasslands. You know roughly what condition they’re in. Then the budget cycle starts, and someone asks the question every asset manager eventually hears:
“So what will it cost to keep these assets working, and are we spending enough today?”
For roads, pipes and facilities, you can answer that. For natural assets, most municipalities can’t yet. That gap matters. An asset with no service targets, no lifecycle plan and no cost estimate is hard to defend at budget time, and easy to leave off the register. If nature isn’t on the register, it’s valued at zero.
Knowing where your wetlands are is a starting point. Knowing what it costs to keep them working is a plan.
Why this matters now
More municipalities now treat natural assets as part of their infrastructure system, and the expectations are rising with them. In Ontario, for example, O. Reg. 588/17 counts green infrastructure as a municipal infrastructure asset. Since July 1, 2025, asset management plans must set out proposed levels of service, lifecycle activities and a financial strategy for all assets. Funders and councils elsewhere are asking the same questions.
An inventory and a condition assessment are the foundation. On their own they don’t answer what services you expect from these assets, what work keeps those services flowing, or what that work will cost.
From inventory to budget in four steps
At Green Analytics, we close that gap by connecting natural asset data to levels of service (LOS) and financial analysis. It’s the same logic you already apply to built infrastructure, adapted for assets that grow, change and regenerate.
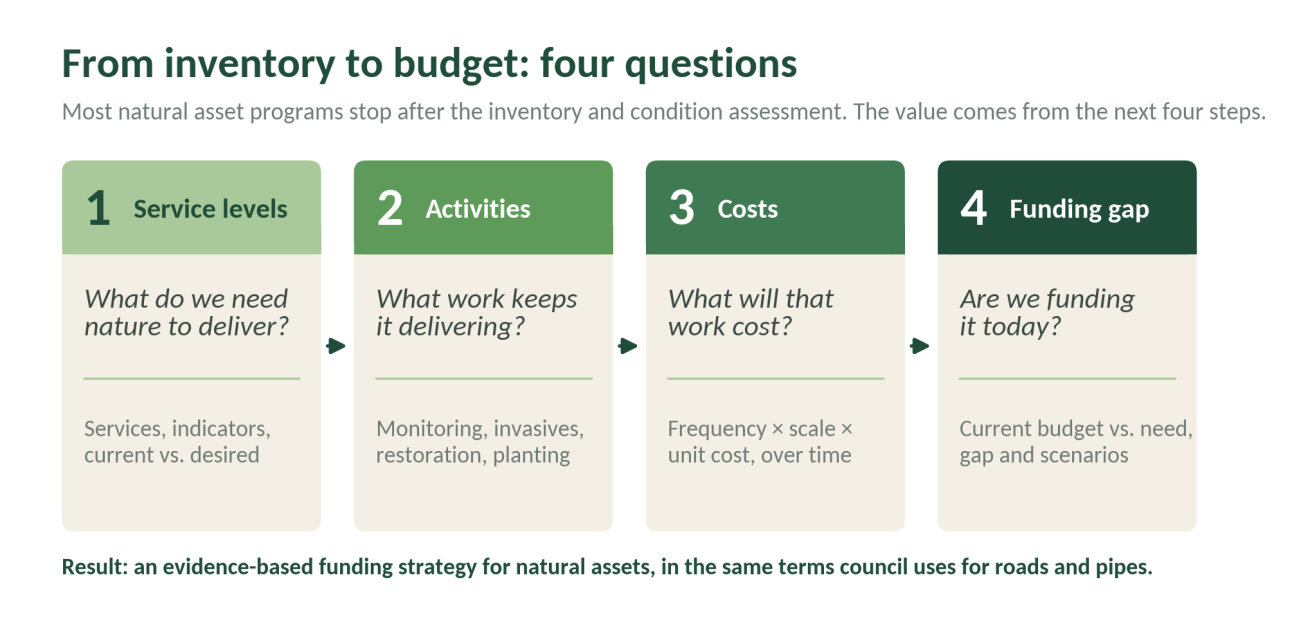
1. Define what you need nature to deliver
Start with outcomes, not acreage. Which services matter most to your community: stormwater management, flood mitigation, water quality, habitat, recreation, urban cooling? For each one, set current and desired levels of service and, where possible, measurable indicators. Condition and risk information then shows where to focus first.
2. Identify the work that keeps services flowing
Next, spell out the lifecycle activities needed to hold current service levels or reach the targets. Depending on the asset, that might be monitoring and inspections, invasive species management, restoration, tree planting or routine maintenance.
3. Put a realistic price on it
Combine the frequency and scale of each activity with the best available unit costs to estimate funding needs over the long term. The result is a cost profile you can put next to your other asset classes.
4. Compare need with what you spend today
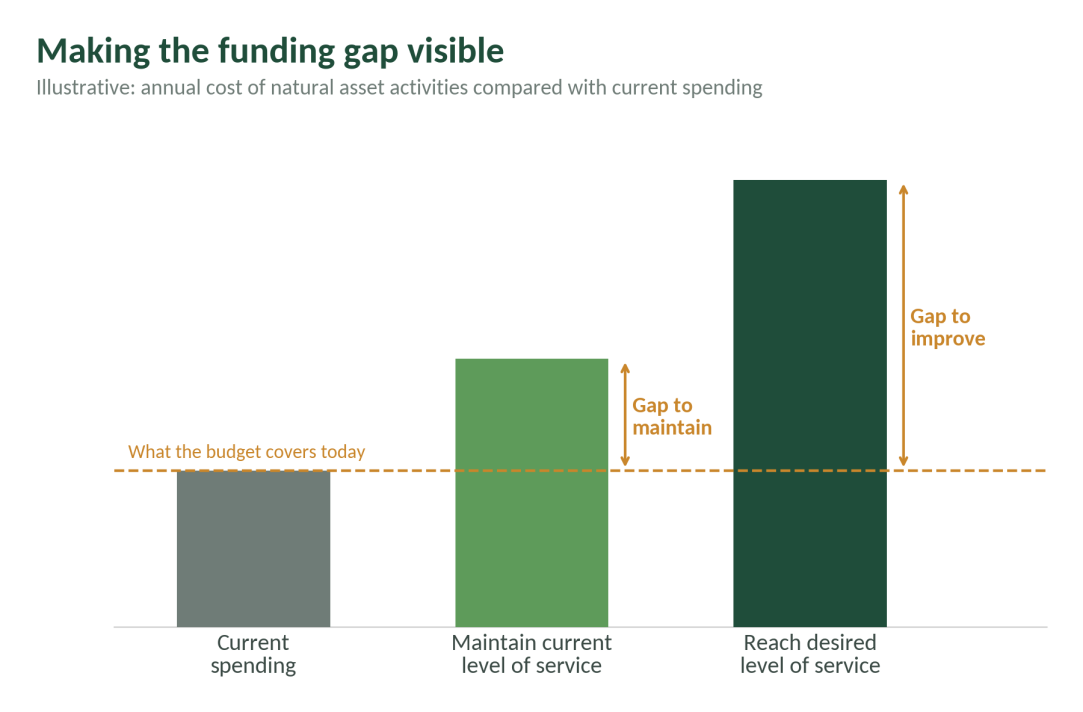
Finally, set those estimates against current spending and budgets. This shows whether today’s funding is enough, where the gaps are, and how costs change under different management approaches or service targets.
In practice: the City of Vernon
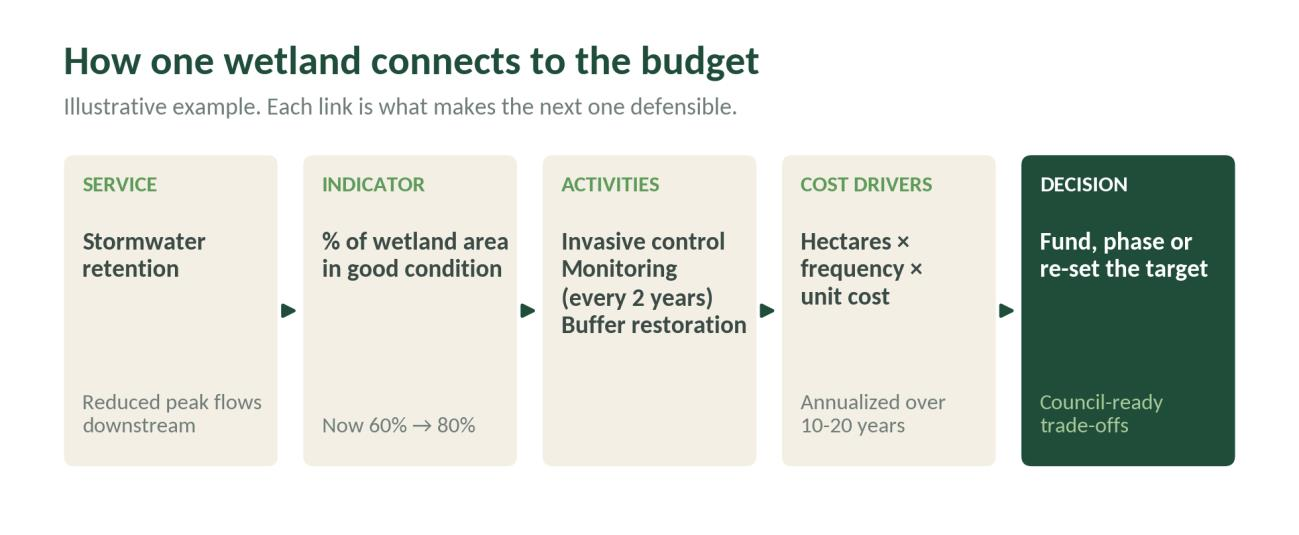
We recently applied this approach in a natural asset management project with the City of Vernon, B.C. Linking service levels to lifecycle activities and costs gave staff something an inventory alone can’t: a clear picture of what sustaining those services would take, in terms that fit the City’s wider asset management and budgeting work.
What asset managers get
- A defensible budget ask. Funding requests are tied to specific services and activities, not general stewardship.
- Visible trade-offs. Council can see what each funding level buys, and what it risks.
- Regulatory and grant readiness. LOS, lifecycle and financial strategy content fits into asset management plans and funding applications.
- Consistency across asset classes. Natural assets are planned in the same language as roads, pipes and facilities.
- A baseline for tracking progress. Indicators and costs can be revisited each budget cycle.
From mapping nature to managing it
Identifying and assessing natural assets is essential, but it’s only half the job. Linking levels of service to the work and costs involved turns natural asset management from an inventory exercise into practical input for budgeting, resource allocation and long-term planning.
Ready to take the next step with your natural assets? Whether you’re updating an asset management plan, preparing a grant application or starting your first inventory, we can help you build the evidence your council needs. Get in touch with Green Analytics.